Improve targeted advertising by analyzing the NYC Subway data
After arriving from Germany at the beginning of March, the bootcamp finally started this Monday. It was an very intense and long week packed with a lot of interesting stuff to learn. As expected, the lectures are high paced which means we have to practice a lot independently and apply it in our projects/weekly challenges. Practicality. This is the main reason why I chose Metis - you learn the right tools in order to apply them in the real-world and solve interesting data science problems. In our first week we immediately dove into pandas, git, matplotlib/seaborn, debugging, some more pandas and complexity theories.
Each morning started off with pair programming which was a fun way to get to know everybody and solve little challenges (similar to codewars.com). Simultaneously, we worked on our weekly (solo) challenge including exploring the NYC MTA turnstile data. Finally, we finished the week off with group presentations of our first project.
First Project:
- Get data from the Metropolitan Transportation Authority (MTA)
- Do exploratory data analysis to look at patterns of transit traffic in NYC
- Design thinking to create imaginative use cases with back stories
- Communicate findings

As a data science consultancy we pitched CUPS a data driven advertisement approach for specifically targeting NYC commuters in order to increase their user base and encourage consumers to purchase coffee using the app. CUPS created a mobile app that offers mobile payment and discovery for coffee shop in major U.S. cities. They offer monthly subscription plans for a set number of coffees or unlimited drinks.
Objective
- Target market: Commuters who use the MTA system and very likely purchase their coffee before work
- Advertisement: at high-traffic MTA stations at peak hours, push notifications to prompt purchases
Analytical Approach
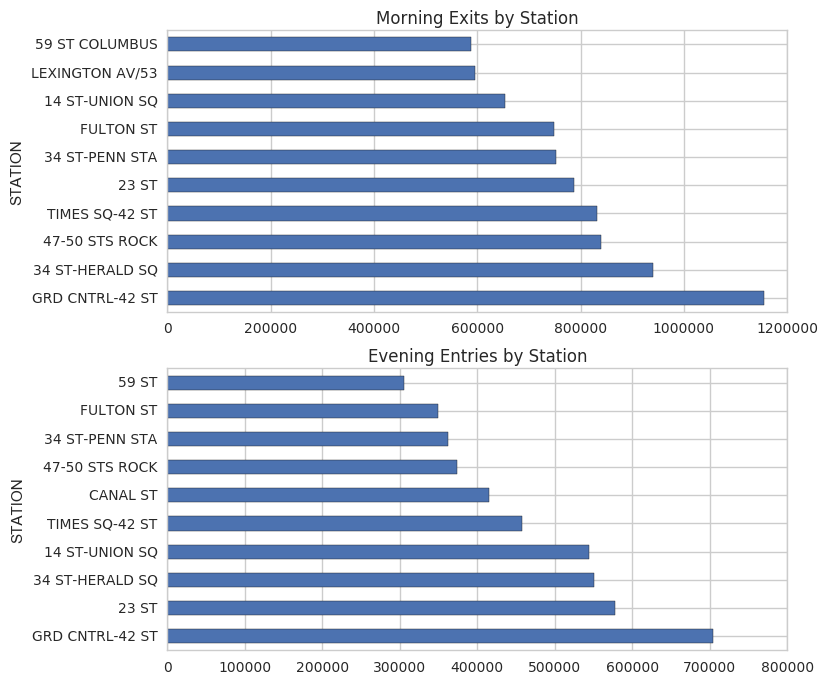
- Analyze MTA turnstile data and determine top ten stations that have the highest advertisement exposure
- Station criterias: high exit rate during morning hours and high entry rates during afternoon/evening hours
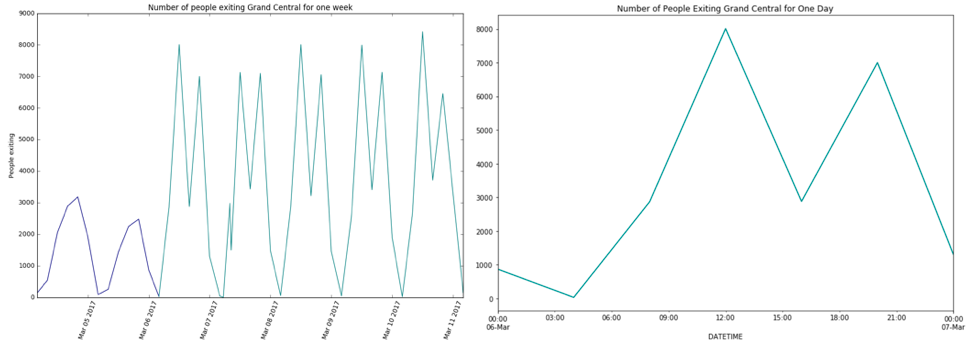
- Visualize data to see weekly trends and determine the best time frames to efficiently deploy advertisement
Results
-
Both grahps show that stations with high amount of exit traffic also have a high amount of entry traffic in the afternoon/evening –> Busiest commuter stations

-
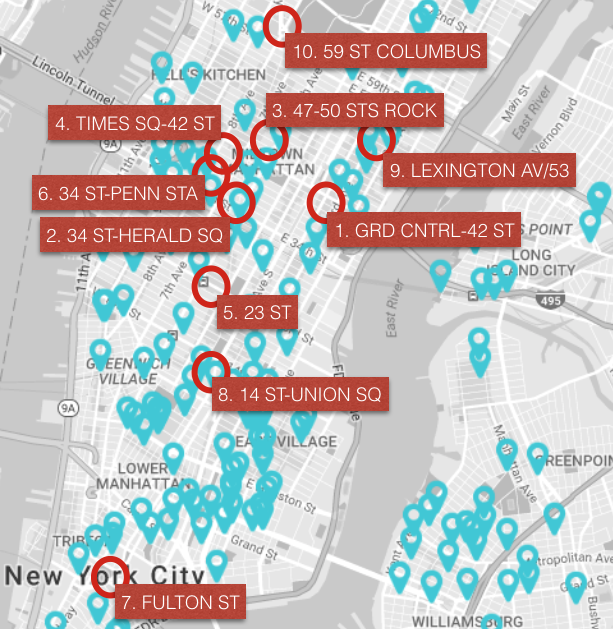
Most of the stations with high morning exit traffic are near areas with a high density of coffee shops

- Exit traffic is significantly higher on weekdays compared to weekends
- Traffic is consistent across weekdays
- Morning and evening peak for weekday exit traffic in Grand Central station which illustrates potential for market expansion through partnerships with nightlife businesses
- Best time to send push notifications with coffee discounts is between 8 AM and 12 PM

Conclusion & Recommendations
- Optimal strategy is to target the ten stations with the highest morning exit rates
- Poster advertisement and mobile ads on Instagram and Facebook around these stations between 8 AM and 12 PM
- Proactively partner with coffee shops in areas of high commuter density and low CUPS coverage
Future Works
- Do the same analysis for nightlife traffic in order to partner with restaurants or bars
- Explore seasonality, expand time horizon and see how subway traffic varies over time to further target ads
- Analyze transit systems of other cities, like San Francisco, which are also covered by CUPS
In conclusion, I would say we worked really well as a team and provided CUPS an interesting use case. To end this week, I am trying to further improve my pandas skills, so I started to work on a data set about airline traffic at the San Francisco Airport to put the things I learned to use.
Best,
Florian